The fire was out. I kept smelling smoke.
I spent three weeks fixing a real database bill, won, and then believed a number claiming one query cost more than my whole monthly allowance.
In June my hosting provider emailed to say a site I run had used 5.5GB of its 5GB monthly allowance. It was seeing ten to twenty real visitors a day at the time, which turned out to have almost nothing to do with the bill. I spent three weeks fixing it, and I did fix it. Then in August I wrote down a number about the same system that was wrong by a factor of five, and believed it for a while, because by then I was the kind of person who found that number plausible.
A bill for traffic I didn’t have
TL;DR
Egress is what it costs to move data out. Store a million rows and read none of them and you pay almost nothing; store ten and read them on every request and you pay for every copy that leaves. It is billed by the byte, it doesn’t care who asked, and that last part is where this went wrong.
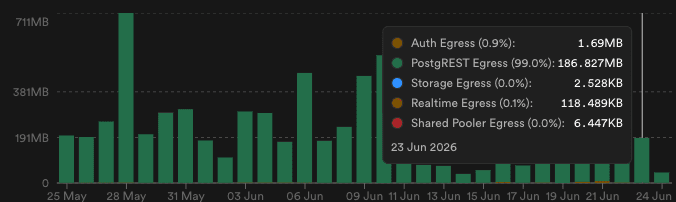
The traffic wasn’t people. Search engine crawlers were walking every game page and every social preview image, and each preview render was making five separate database calls. Multiply that by a catalog in the thousands and by every crawler that has ever found a sitemap, and a site with a modest audience becomes one that reads its own database all day on behalf of software.
The provider gave me until 7 July before fair use enforcement began. That is a real deadline attached to a real number, and it focuses the mind.
Eight pull requests, and the names tell the story
TL;DR
The fixes were unglamorous. Cache the expensive queries so a thousand crawler hits collapse into one read. Collapse the five calls behind each preview image into one. Stop the browser from speculatively loading pages nobody had asked for. Block the worst-behaved crawler outright. Trim the columns nothing rendered.
I can tell how that went by the branch names, which degrade in a way I recognize:
bb/egress-fix
bb/egress-fix2
bb/egress-hotfix
bb/egress-again
bb/egress-cont
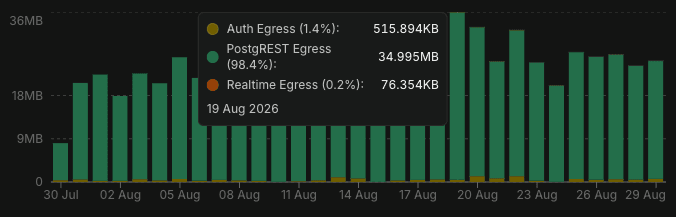
Eight of those merged between 10 June and 1 July. It worked. By August the site was steady in the mid twenties of megabytes a day, comfortably inside an allowance that works out to about 170MB a day. The fire was out, and I had earned a fairly detailed mental model of how this particular system leaks.
800KB a refetch, seven gigabytes a month
TL;DR
The query fetched the whole game catalog to build a voting queue. I measured one row at roughly 484 bytes, multiplied by 1,667 games, and multiplied again by how often the cache refreshes in a month. That gives about 788KB per refetch and roughly 6.5GB a month, which I rounded to seven.
Seven gigabytes against a five gigabyte allowance. That number justified a rewrite, and I did the rewrite.
Wrong by 5x, and then still wrong
TL;DR
The compression. The database sends its responses gzipped, and the client asks it to. What I had measured was the size of the data sitting in memory, not the size of it going over the wire. The rows here are mostly long image URLs, which compress extremely well. Re-measured, a row costs about 96 bytes in transit rather than 484. Nearly five times smaller.
The trap in the correction. My first attempt to verify this was also wrong, and it was wrong in a way I want to record, because it looks exactly like success. Node decompresses responses for you and leaves the header saying it was compressed. So you check the header, see content-encoding: gzip, then measure the body and get the decompressed size:
content-encoding header : gzip
bytes handed to you     : 49,307
bytes actually on wire  : 10,161
Both readings are honest. The header is telling the truth about the transfer and the byte count is telling the truth about the buffer, and together they produce a confident wrong answer. Only asking for the raw bytes, with the decompression explicitly turned off, showed the real figure.
And the corrected number was still not a cost. Fixing the compression gave 1.29GB a month, and I wrote that down as the real figure. It is not. It assumes the cache expires and refetches every five minutes, continuously, all month, which requires somebody to be on the site in all 8,640 of those windows. At twenty visitors a day, most windows are empty. What I had actually produced was a less wrong ceiling, presented as a measurement.
Seven gigabytes a month is 236 megabytes a day
TL;DR
The claim was 6.9GB a month from a single query. Divided by thirty, that is 236MB a day. The whole site, every query it makes, peaked at 35.6MB a day that month and typically ran around 26.
It is worse than that, and better as a lesson. The allowance is 5GB a month, which is about 170MB a day. So the number I wrote down claimed that one query, on its own, exceeded my entire monthly allowance by forty percent. On a project that had spent June getting back under that exact limit.
If it had been true, I would have been in violation again immediately, and I would have received a second warning email. I had not received a second warning email. The disproof was already in my inbox, and it required no tooling, no profiler, and no measurement at all.
A component estimate that is never reconciled against the bill can be wrong by any factor at all, and nothing in the system will object.
The number agreed with me
TL;DR
A claim that this database was hemorrhaging gigabytes wasn’t surprising to me in August. It was familiar. I had just spent three weeks proving that exact sentence true, and I had the branch names and the graphs and the deadline to show for it.
So the number arrived pre-approved. It matched a shape I had learned the hard way, and things that match a hard-won shape do not get audited. The pattern recognition that made me fast at the real problem is the same thing that made me credulous about the fake one, and I do not think those can be separated. You get both or neither.
The only defense I have found is mechanical rather than intellectual. A component estimate is a claim about a total, and the total is usually already printed somewhere. Go and look at it. If your estimate for one part exceeds the measured whole, you have learned something before writing any code, and the check takes about as long as reading this sentence.
A good fix with a bad justification
TL;DR
The original query read the entire catalog to show one card at a time. The rewrite reads a bounded page instead: about 47KB per refetch regardless of how large the catalog grows.
That is worth having. But the benefit is not the number I claimed. It is that the old cost scaled with every game added and the new one does not. The problem was a ceiling that grew, not a bill that hurt.
Which means the fix produced no visible drop in the graph, and should not have. If I had gone looking for one to prove the work mattered, I would have found nothing, and I would have been measuring the wrong thing for the third time in one project.